Live Chat
Need Help?
Privacy Policy {"Stage_EswLiveAgentDevName":"EmbeddedServiceLiveAgent_Parent04I2f0000004CVTEA2_18385bcda98","Stage_SalesforceOrgId":"00D2f0000001OfB","Agent_Available_Header":"No problem. Chat with our engineering experts or schedule a call that's convenient for you.","Prod_SalesforceOrgId":"00Do0000000KAkK","Stage_SalesForcePath":"https://microchip--chipbot.sandbox.my.salesforce.com","Prod_EswLiveAgentDevName":"EmbeddedServiceLiveAgent_Parent04I3l000000CaZuEAK_184c4646b8d","Prod_BaseLiveAgentContentURL":"https://c.la4-c3-ph2.salesforceliveagent.com/content","Stage_ButtonId":"5732f0000008PHf","Prod_BaseLiveAgentURL":"https://d.la4-c3-ph2.salesforceliveagent.com/chat","Prod_ButtonId":"5733l000000Gonb","Stage_BaseLiveAgentURL":"https://d.la3-c1cs-ia2.salesforceliveagent.com/chat","Stage_JsUrl":"https://microchip--chipbot.sandbox.my.salesforce.com/embeddedservice/5.0/esw.min.js","Agent_Unavailable_Header":"An agent is not available to chat right now however please feel free to schedule a call with one of our team members.","Prod_SalesForceLAPath":"https://microchip.secure.force.com/mDirectLA","Prod_SalesForcePath":"https://microchip.my.salesforce.com","Stage_SalesForceLAPath":"https://microchip--chipbot.sandbox.my.salesforce-sites.com/mDirectLA","Stage_DeploymentId":"5722f0000008OpU","Service_Force_Url":"https://service.force.com","Prod_DeploymentId":"5723l000000GoUh","Schedule_Call_Url":"https://microchip.my.site.com/schedulemeetingportal/s/","Stage_BaseLiveAgentContentURL":"https://c.la3-c1cs-ia2.salesforceliveagent.com/content","Prod_JsUrl":"https://microchip.my.salesforce.com/embeddedservice/5.0/esw.min.js"}
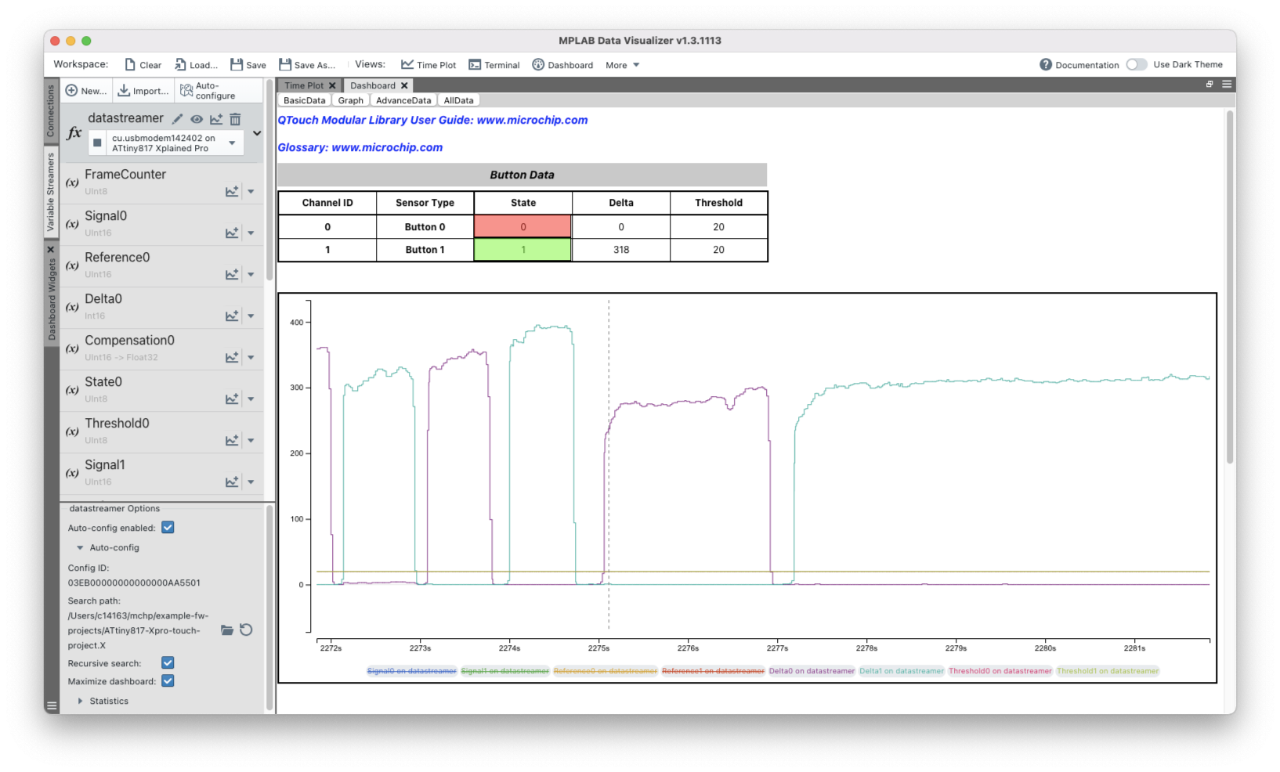
Troubleshooting your code's run-time behavior has never been easier. MPLAB® Data Visualizer is a free debugging tool that graphically displays run-time variables in an embedded application. Available as a plug-in for MPLAB X Integrated Development Environment (IDE) or a stand-alone debugging tool, it can receive data from various sources such as the Embedded Debugger Data Gateway Interface (DGI) and COM ports. You can also track your application's run-time behavior using a terminal or graph. To get started with visualizing data, check out the Curiosity Nano Development Platform and Xplained Pro Evaluation Kits.
Key Features
Downloads and Documentation
Need Some Help?
We are here to support you. Contact our Client Success Team to get assistance with your design.

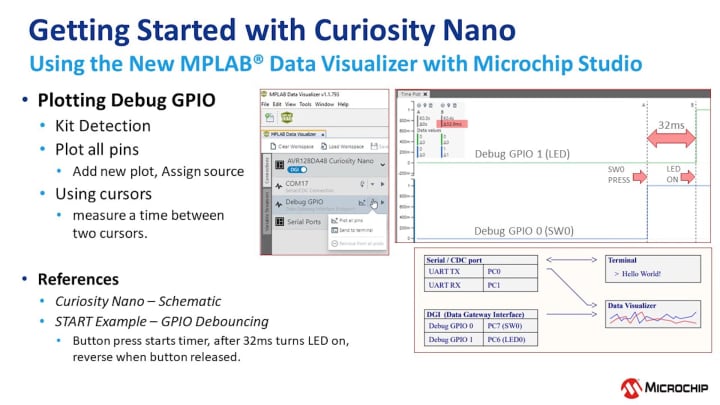
Using the MPLAB® Data Visualizer
In this video, learn about:
- Plotting debug GPIO
- Kit detection
- Plot all pins: add new plot, assign source
- Using cursors to measure a time between two cursors